How to Read a Candlestick Chart in Crypto
 One of the most important thing for crypto investors to learn how to do is how to read a candlestick chart in crypto. Without knowing how to read a chart, it is impossible for investors to make educated guesses on the movement of a cryptocurrency. One of the most widely used style of charts is the candlestick chart. On this chart, movement is marked by shapes that are referred to as candles & wicks. By looking at a candlestick chart, investors can easily determine the pattern that a coin has been on.
In future videos, we will show you more detailed analysis on how to read charts, make predictions, & how to use those predictions for day trading strategies. However, for now we are just going to focus on what a candle is & how to read them. The most important this is to learn exactly what the candles themselves represent. Here is a break down of each term.
Terms in Candlestick Charts
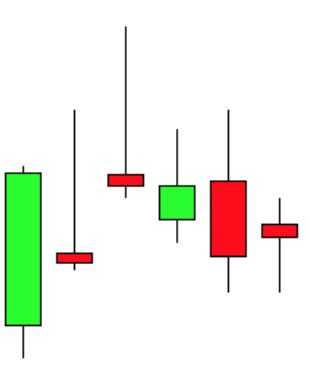
Open: This is represented by the top of the red candle and the bottom of the green candle. This is where the price started at the beginning of the allotted time. For instance, if you were looking at a daily chart, the open would be where the cryptocurrency was at 12am.
Close: This is represented by the bottom of the red candle and the top of the green candle. This is where the price closed at the end of the allotted time. For instance, if you were looking at a daily chart, the close would be where the cryptocurrency was at 11:59pm.
High: This is represented by the high point of the wick on the candle. This is the narrow line that comes out of the top of the candle. This is the highest point where a cryptocurrency coin went to during the allotted time.
Low: This is represented by the low point of the wick on the candle. This is the narrow line that comes out of the bottom of the candle. This is the lowest point where a cryptocurrency coin went to during the allotted time.
Is Learning How to Read a Candlestick Chart in Crypto Important?
In my opinion (not financial advice), learning how to read a candlestick chart in crypto is important. As an investor, you need to know everything you can know in order to make informed decisions. As I mentioned, we will go into technical analysis down the road. However, technical analysis & chart reading is only one piece of the crypto puzzle.
What is actually even more important than the chart reading, is staying up to date with the current trends and news stories of the day surrounding the crypto world. All the chart reading in the world can’t help you if a coin gets a terrible news story. News will make the price rise or plummet based on the nature of the news. You really need to use an all-encompassing strategy in order to consistently make money whether there is a bull market or bear market.
Thanks for reading!